Market Demographics

To better understand the market & economic value of the equine industry, one must consider the many activities the many breeds of horses and ponies, and the thousands of equine enthusiasts. These enthusiasts represent every walk of life, live in urban and rural areas and fill their homes, offices, and vehicles with symbols of their interest in horses.

Considering all the farms, ranches and stables, manpower, land, equipment, facilities and products involved, one begins to understand how the horses and people involved represent an influential industry.

Together, the breeding, raising, training, showing, racing, riding and care of over 8 million horses represents a vast industry that when pulled together in all its diverse aspects makes a huge contribution to the country's economy.


1. The Horse industry 

Because this website is hosted in the USA, we are including here the information released in 2016 by the US Department of Agriculture and the American Horse Council. Statistics for other countries are available through simple online search, Google being a good source.

HORSES
OWNERS

· Number of horses: 9M+
    American Quarter Horse: 3.1M
    Thoroughbred: 1.3M
    Other: 4.6M

Note: Europe: 5.8M+
          South-America: 10M+
          Asia, Oceania, Africa: 15M+

· Horses by state:
    Texas: 1,000,000
    California: 700,000
    Florida: 500,000
    Oklahoma: 326,000
    Kentucky: 320,000
    Ohio: 307,000
    Missouri: 281,000
    North Carolina: 256,000
    Colorado: 256,000
    Pennsylvania: 256,000
    Others: 35 states with over 100,000

· Use:
    Recreation: 3.9M
    Showing: 2.7M
    Racing: 840k
    Others: 1.7M (rodeo, police, etc)


· GDP by Activity
    Racing: $10.6B
    Showing: $10.8B
    Recreation: $11.8B
    Other: $11.8B
    Total: $38.8B


·  Number of owners:  2 million

· People involved: 7.1 million (service providers,
employees and volunteers)

· Demographics
    Gender: mostly females

    Prominent Age Range: 38 – 45
    Employment Status: employed
    Marital Status: Married
    Urban or Rural: Rural

· Household Income:
   *Median income: $60,000
   <$25,000:14%
   <$50,000: 38%
   <$75,000: 64%
   >$75,000: 36%

· Owner Activities:
    Recreational Rider: 85%
    Competitive Rider: 30%
    Horse Breeding: 11%
    Horse Facility Manager: 10%
    Grooming and Exercising: 9%
    Professional Trainers: 7%
    Racehorse Owner: 2%


2. FEA PRIMARY MARKETS


 Because of the nature of the horse-related industry, the demographics is such that sponsorship could be very beneficial to pretty much any type of business, of any size.

    Multiple disciplines
One of our main markets is the same as the U.S. Equestrian Federation (USEF is the governing body of equine sports in the country) which defines their market demographics as being the following: 
    ♦ 85% are women (the most influential purchasing group in the country) 
♦  66% with a college degree
♦  Average income: $185,000
♦  38% with a net worth above $500,000
80% make or directly influence purchasing decisions at work
♦Market value of average home: $594,000
♦ 22% own two or more homes
♦ Average 30 nights/yr in a hotel
♦ Average 3 vehicles per household
♦ 40% own a farm; 66% of those are ten acres or more
♦ Own an average of four horses
♦ Compete at least six times per year

With a reported direct economic impact of almost 40 Billion dollars a year, it is no surprise that horse show spectators and exhibitors are a highly influential group of people, with a high spending power.


 Equine-assisted Therapy environmentMarket exposure to Equine-Assisted Therapy Directory
FEA has created the largest online directory of entities offering equine-assisted therapy services, over 1,000 in the U.S. alone (covering every state). The overall exposure of this market is estimated at well over 500,000 individuals when including 150,000+ participants, parents, volunteers and past participants.

Other than age-related stats there are few demographics rekated this this market for the simple reason that is relates to the general population and people from all walks of life are involved. The chart shown here demonstrates the number of people (market size) of this market segment divided in age groups with the corresponding percentage of the total market exposure of approximately 550,000.

One additional ineresting fact is that an estimated 48,000 veterans-related individuals are connected to this environment, through different veterans programs.


• Collegiate program 
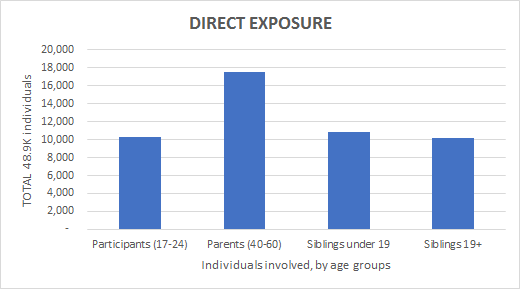
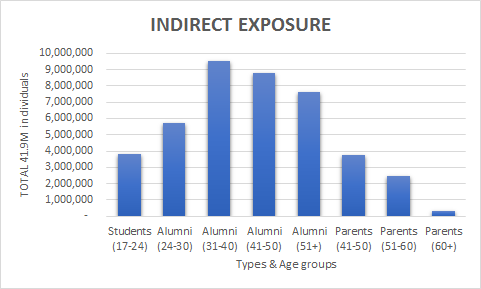
A market with multiple facet opportunities. FEA totally supports the work of  the NCAA (through NCEA) and IHSA which together cover the majority of large American colleges, offering exposure to over 450 colleges having equestrian teams, with over 10,000 participants and a student body of 3.8 million. And as for any other collegiate sport, the alumni aspect is very important especilly with the 25% attrition rate where new students replace the grads of the previous year. Taking into consideration the participants, alumni and the families, we can extrapolate and estimate the following demographics:

• DIRECT EXPOSURE: 48,900 
Includes current participants of students in an equine-related college program.

Also includes their parents and siblings. A total of almost
49,000 individuals with influential buying power.

• INDIRECT EXPOSURE: 41.9M

Includes stuent bodies of the colleges with equine-related programs, with their
parents, plus the very large but important alumni. The total is 41.9M individuals.


 Vehicle Donation program
The general public is our target market when it comes to this program (see FEA's Vehicle Donation program for details) which is also made available to other non-profits, from which service an exponential growth can be expected. More information will be available soon on this program.